Caitlin Gilbert

Data Reporter @ The Washington Post. For my neuroscience PhD work on songbird brains, I developed skillsets in data mining, statistical modeling, machine learning, and visualization.
Expertise: the brain / linguistics / elections / disinformation / genomics
Washington Post author page | Financial Times author page | LinkedIn | Github
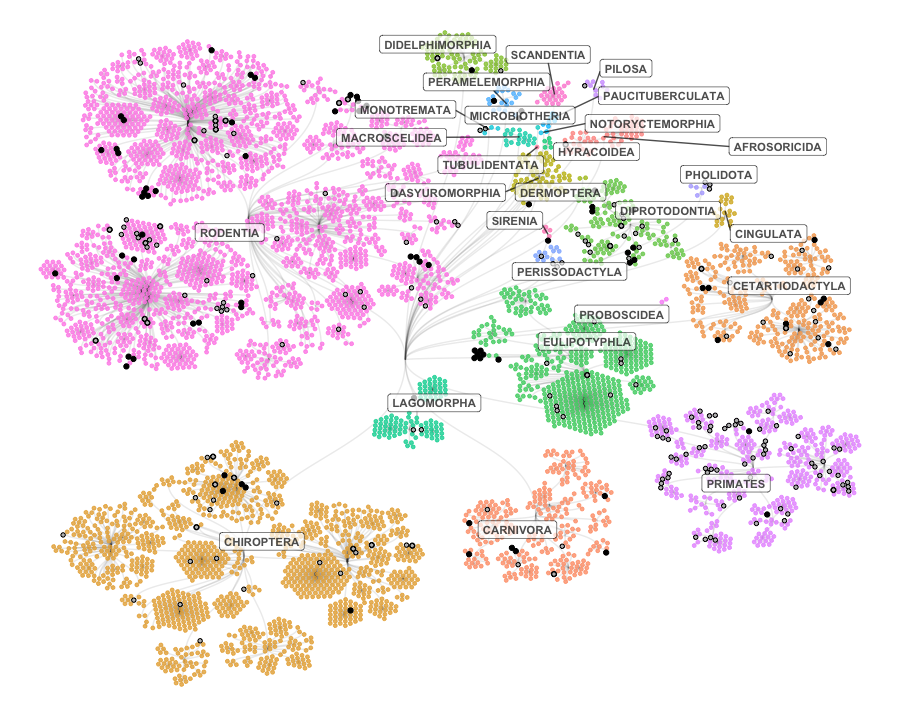
Conservation Status of Red List Mammals, Across Hierarchical Orders
Visualization Details: Plot represents 5,850 mammalian species on IUCN’s Red List, with different taxonomic orders hierarchically colored and labeled. Black points represent extinct or possibly extinct species. Grey points represent species that are critically endangered or extinct in the wild. Species data is from the IUCN’s site. Code to generate plot adapted from Maarten Lambrechts. Plot was made using R.